Workload Tracker — Full-Stack Productivity Tool
Designed and built a full-stack workload tracking tool from concept to deployed MVP, enabling users to log hours, visualize capacity, and share dashboards.
- Client
- Personal Project
- Role
- Product Designer, Developer
- Years
- 2026
Challenge
As someone who works with multiple teams and with different processes, I often find myself context switching every few hours as I have several deliverables throughout the day. While I have grown accustomed to it, there are times when I no longer know which one of the processes I'm working on is taking up so much of my time, and if I have extra bandwidth to accommodate some requests. I then found myself wishing I had something that I could show to people whenever the would ask me, "Ginny, can you accommodate this?"
Action
I co-built a workload tracking tool through AI-assisted development in Kiro IDE. This was my first ever project on Kiro, so the initial build was scrappy — I literaly vibed my way through the whole thing. Kiro, build me a workload tracker. Add this, fix that. I was the only user, after all.
Eventually, I figured this was a platform that I could share with my peers, if they ever wanted to have a workload tracker of their own. I then made some adustments to turn it into the tool it now is today.
The Three Iterations
Three versions of the tool, each serving a different purpose:
- Main app — Full production version with Google OAuth, Supabase database, and team dashboards. This was the initial build as I was just testing out AI-assisted development back then and thought that implementing OAuth was as easy as pie. I was wrong not only about the latter, but also about the fact that the only way to keep the logs secure was through email log in.
- PIN-auth variant — This is a lightweight personal version with simple PIN login, no OAuth complexity. Just a username and a PIN, and you're ready to go. Perfect for people like me who need the least amount of friction to log tasks.
- Static demo — Single HTML file proof-of-concept for stakeholders.

- Dark mode by default — Reduces eye strain for a tool you check throughout the day
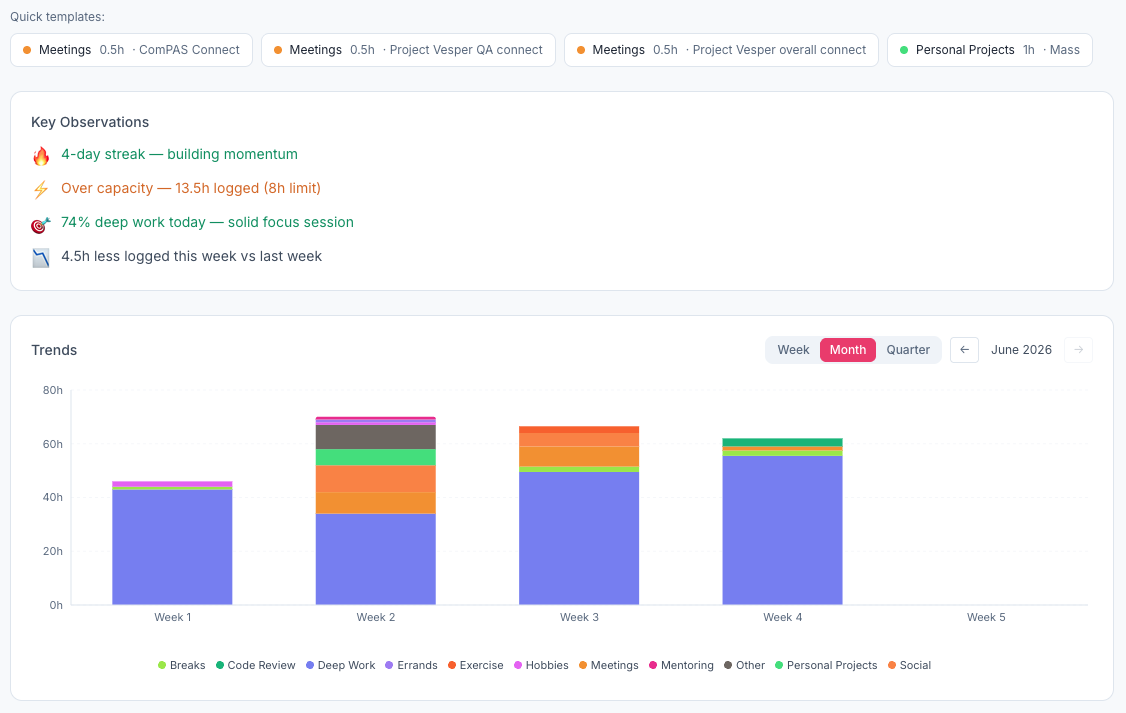
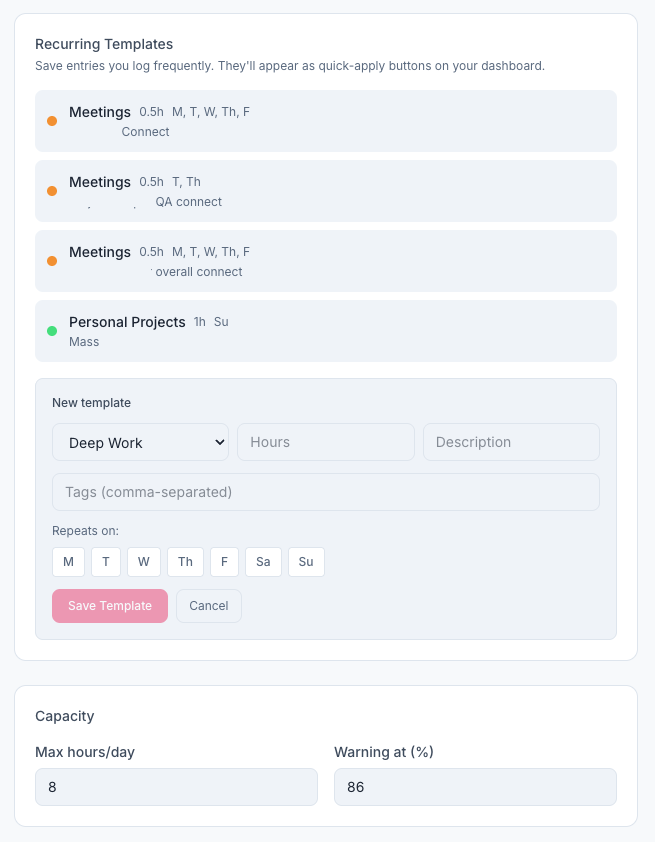
- 85% productivity flag — The tool alerts you when you're approaching burnout (research suggests sustained 85%+ utilization leads to quality drops). The user can also adjust their productivity flag percentage to their liking.
- Capacity meter front and center — The most critical information is the first thing you see
- Quick-add interaction — One-click logging without navigating away from the dashboard
- Shareable public dashboards — Toggle visibility so teammates or managers can see your load without needing accounts
Tech & Design Stack
Next.js, Tailwind CSS, Recharts (data visualization), Supabase PostgreSQL, Google OAuth, Vercel deployment.
Results
~3-4 hrs
From concept to deployed MVP
14
Bugs identified and resolved
- Built from concept to deployed MVP in ~3-4 hours
- 3 deployable versions created (production, lightweight, demo)
- WCAG AA compliant color contrast (5 combinations audited and fixed)
- 14 bugs identified and resolved during build
- Documented with user guide, developer guide, and project summary
- Architected for future scaling (org-wide deployment, SSO integration)